


Why Do NIS 2 KPIs Mark the True Boundary Between Box-Ticking and Cyber Resilience?
Every organisation claims to take cyber-security seriously, yet the tools they use to prove it often betray otherwise. Audit checklists, spreadsheets, and dense policy packs lull teams into thinking they’re genuinely prepared-until the regulator, a supplier, or an incident asks a question their documentation can’t answer in real time. That’s where NIS 2’s demand for meaningful KPIs (Key Performance Indicators) redraws the line between a paperwork exercise and actual cyber maturity.
The gap between what’s documented and what’s actually happening gets revealed at the worst possible moment.
Regulation is catching up with reality. Directors, boards, and customers are no longer satisfied by a printed SoA or a policy library-they expect proof of coverage, speed, and self-healing capacity that goes beyond annual reviews or ticked questionnaires (ENISA, 2023). KPIs like Mean Time to Recovery (MTTR), comprehensive asset and supplier coverage, and continuous improvement actions form the pulse-checks that modernise cyber assurance. They turn the ISMS from a static report into a living evidence machine.
What changes when KPIs become the foundation? First, there’s nowhere to hide: gaps in coverage, slow incident responses, and “policy without proof” are surfaced-and, crucially, must be improved. The best organisations now present boards and regulators with evolving dashboards, not just reviews. Buyers and partners look for those metrics and use them as a de facto trust philtre, especially when evaluating SaaS and digital supply chains.
NIS 2 KPIs shift compliance from static reviews to real-time monitoring-making resilience visible, traceable, and provable at every level, not just during audits.
Teams that know their blindspots before outsiders spot them are already a step ahead.
What Do Real MTTR, Coverage, and Effectiveness KPIs Look Like in Practise?
When clients or auditors ask “How well are you really covered?” or “How fast can you recover from adversity?”, the best responses are logged, granular, and up-to-date. MTTR (Mean Time to Recovery) measures how quickly teams detect, contain, and restore from disruptions-by vulnerability, attack, or system failure. Coverage metrics map what’s protected and, more vulnerably, where the organisation has unsupervised gaps: under-monitored SaaS, legacy endpoints, shadow IT, and unvetted suppliers (ENISA, 2023). Effectiveness KPIs track not just pass/fail, but the story of improvement: which failures led to which changes, and how rapidly those changes are embedded and verified.
Maturity isn’t about the absence of incidents-it’s about the speed and certainty of your improvements.
A CISO’s credibility, and a SaaS company’s commercial survival, now ride on these specifics. Boards ask for one-page dashboards showing MTTR trends over time; regulators want gap analyses highlighting not just “yes, we have controls,” but “here’s our current 88% coverage, our riskiest 12%, and what’s being done.” Effectiveness gets measured by closed improvement actions, test failure count, follow-up time to resolution, and evidence linkage.
Here’s how these expectations operationalise against ISO and NIS 2:
| Expectation | Operationalisation | ISO 27001 / Annex A Reference |
|---|---|---|
| “How fast do we recover from attacks?” | MTTR: Detection, containment, recovery logs | A.5.26, A.5.27, A.5.24, A.8.15 |
| “How complete is our asset/partner coverage?” | % coverage: Inventory, review cycles, exception logs | A.5.9, A.5.12, A.8.1, A.8.22 |
| “What improvements have we implemented?” | Action log, policy/role update records | A.5.29, A.5.27, A.5.28, 9.3 |
| “Are all controls evidenced?” | Control/KPI → asset/test/evidence linkage | A.6.1, A.8.15, A.8.8, SoA |
Consider a scenario: a SaaS company that, during an ENISA-driven audit, was unable to quickly prove which partners and endpoints were actively monitored, nearly lost a critical government customer. Only after they surfaced their automated dashboards-pulling from endpoint management, SIEM, and coverage registers-did the client and regulator allow them to retain the deal. Documentation was not enough; real evidence of ongoing coverage won their reprieve.
MTTR, coverage, and effectiveness KPIs-when integrated business-wide-become the language that proves resilience, exposes blindspots, and drives improvement before an audit or crisis demands it.

Master NIS 2 without spreadsheet chaos
Centralise risk, incidents, suppliers, and evidence in one clean platform.
Can KPI Collection Be Automated Without Compromising Audit-Readiness?
If your compliance evidence is stitched together from manual spreadsheets, backup exports, and monthly summaries, your audit process is always fragile and prone to error. In contrast, modern risk leaders automate KPI collection: SIEM solutions feed incidents and recovery times; asset management tools track coverage in real time; ticketing and change management logs close the loop between failures, fixes, and their retesting (ONETRUST, 2024). Policy platforms ensure acknowledgements and trainings are recorded, not presumed.
Audit pain comes from surprises-automation is how surprises are eliminated before regulators, buyers, or leadership uncover them.
This is why robust ISMS platforms like ISMS.online anchor every KPI to an underlying log. Automated SIEM and incident tickets set MTTR as a real number-complete with best, worst, and average-case trendlines. Asset scans reveal which endpoints or SaaS accounts fall outside policy, triggering exceptions and fresh tasks for practitioners. Policy rollouts, acknowledgments, and training completions are timestamped; failed incidents or tests trigger improvement logs and version-controlled updates.
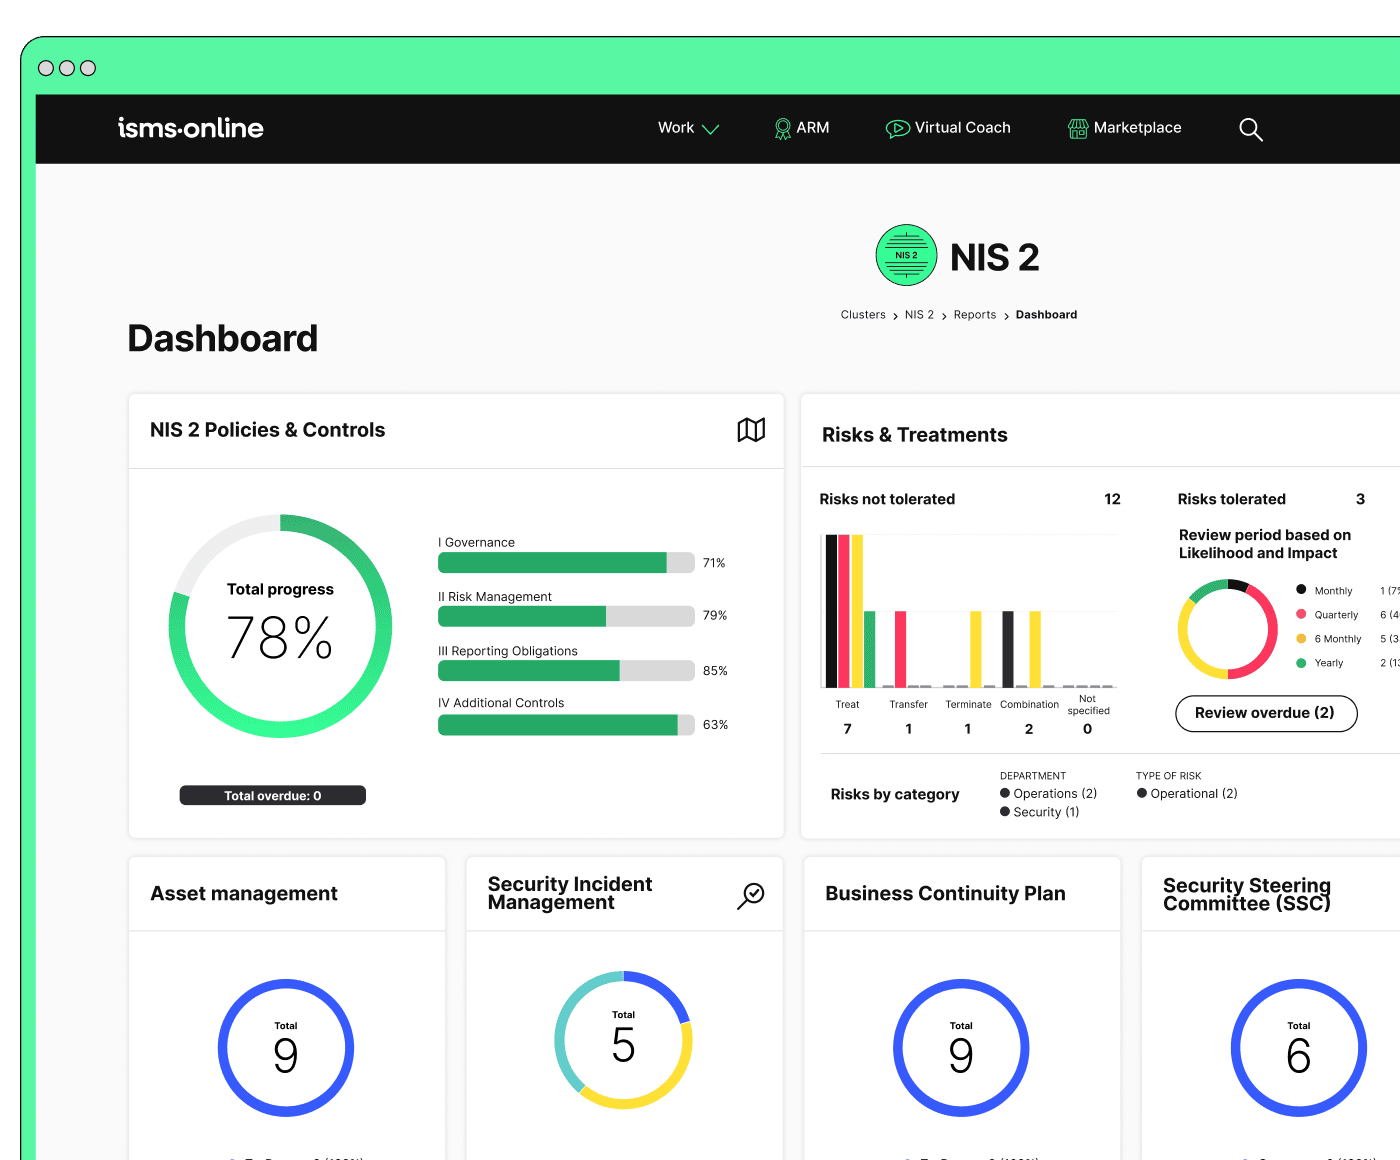
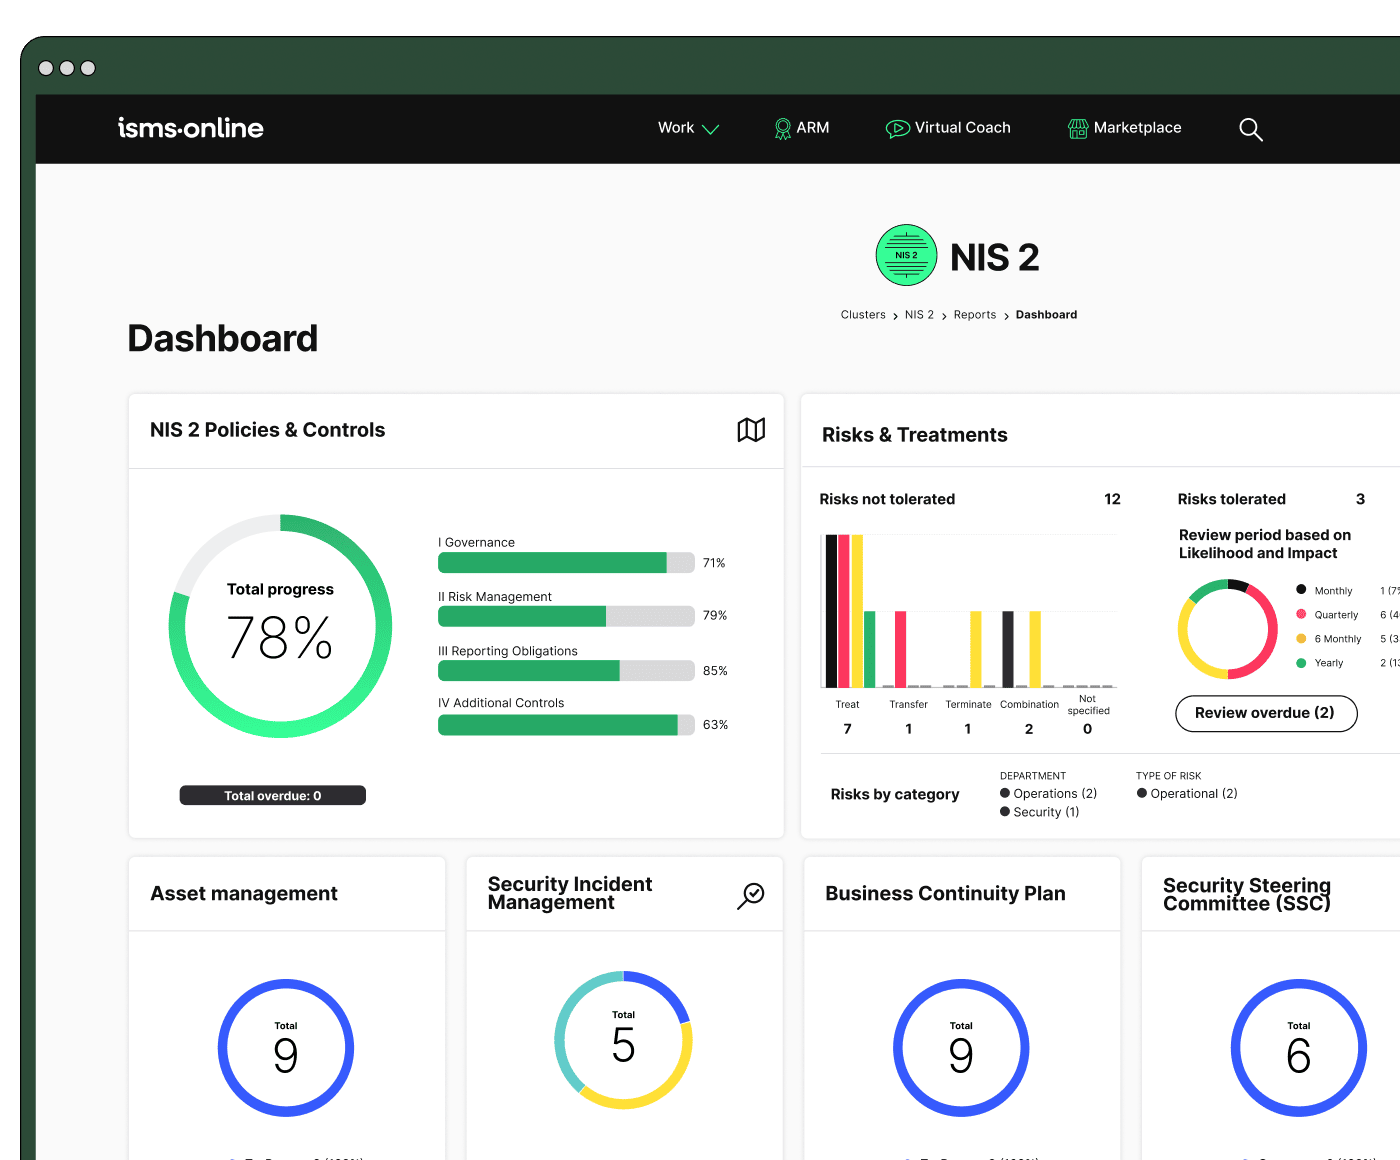
A day-to-day KPI dashboard powering your ISMS might provide:
- Live count/trend of incident response times (MTTR and best/worst cases)
- Asset and supplier coverage percentages, with outliers highlighted
- Closed improvement actions, pending actions, and overdue responses-cross-referenced to controls and roles
- Evidence linkage for controls (e.g., SoA mappings, policy document trails)
The most trustworthy organisations let any auditor or exec view their last 5 incidents-complete with underlying improvement actions and recovery proof-without needing to scramble.
Automating KPI capture through integrated platforms ensures every metric is current, evidence-backed, and easily surfaced for both audit and operational review.
How Does the NIS 2/ENISA Effectiveness Cycle Work-And Why Is It Central?
Beyond logging, NIS 2 and ENISA both demand a feedback cycle where every incident, coverage drift, or test triggers change. Static numbers mean nothing unless action is demonstrated-and proven with traceable, timestamped records (Splunk, 2024). For most that means:
What matters isn’t having a metric-but what you fix, update, or escalate when that metric raises an alarm.
After a major incident: the best teams immediately launch a post-mortem-root cause analysis, action register, and new controls, all logged and retrievable. When SLAs are missed, risk registers escalate the exposure, triggering a management review and corrective fix. Coverage gaps lead to renewed inventories, partner contract reviews, or tool upgrades. Policy or control failures always result in a closed-loop revision: updated procedure, fresh evidence posted to the audit register, and a traceable hand-off to accountable team leads.
Traceability Mapping: From Trigger to Audit Evidence
| Trigger | Risk Update | Control / SoA Link | Evidence Logged |
|---|---|---|---|
| Major incident | Root cause reviewed | A.5.27, A.8.15 | Post-mortem, updated controls |
| SLA missed | Escalated in risk reg | A.5.26, A.8.22 | Review/action logs, report |
| Coverage drift | Inventory/partner fix | A.5.9, A.8.1 | Audit log, re-inventory |
| Test failure | Policy/procedure update | A.5.29, 9.3 | Policy revision, audit record |
For practitioners, this is a shift from reactivity to “audit by design”: logs always reflect reality; evidence is already there before the regulator or board asks. Instead of hunting for post-hoc explanations, you show a living improvement engine, ready for scrutiny at any time.
Snippet anchor:
A true NIS 2/ENISA effectiveness cycle demands every metric be attached to logged improvements, role accountability, and live audit evidence-proving a culture of continuous readiness and adaptation.
Be NIS 2-ready from day one
Launch with a proven workspace and templates – just tailor, assign, and go.
How Is ENISA’s “Effectiveness” Actually Tested-And Why Do Boards Now Demand it?
ENISA and NIS 2 move effectiveness from a theoretical goal to an operational test: simulated attacks, red/blue-team exercises, and ongoing scenario planning are only as valuable as the action and evidence they produce (ENISA Cyber Stress Testing). Boards and regulators now expect:
- For critical business processes, regular scenario-based drills and real incident root cause reviews
- Every test result triggers a logged improvement, mapped directly to controls or technical processes
- Every improvement must be re-tested and results evidenced
- Complete, timestamped audit trails showing changes, responsibles, and retest results
Real effectiveness is the trail of improvements that follow every incident or simulated test.
In high-performing environments, the typical chain moves from test → improvement action → retest → audit trail. Failing to automate these hand-offs leaves you stuck in compliance limbo-one-off improvements that fade, no way to prove ROI, and, occasionally, “audit fatigue” where the same finding returns year after year. Boards and leadership want trends showing shrinking MTTR, growing coverage, and identifiable learning from each test.
Takeaway:
If your effectiveness tests and improvement cycles end up in files or emails, you’re not ready for ENISA’s scrutiny. Every finding must be mapped, logged, and re-tested within your evidence system-for both governance and operational resilience.
What Makes an Organisation Audit-Ready-And How Do KPIs Bridge the Gap From Numbers to Board Confidence?
Audit readiness comes down to two factors: the ability to instantly surface evidence for any KPI, and the confidence that every number is continually reviewed, improved, and role-accountable. ISMS platforms should facilitate this with:
- Timestamped incident/response logs linked to improvement actions
- Complete asset and partner coverage documentation, with policy acknowledgment cycles
- Closed-loop feedback for every flagged risk or test (issue reported, update tracked, improvement verified)
- Board-level review and sign-off, logged in the platform
| Pitfall | Board/Audit Signal | Mitigation |
|---|---|---|
| Static tracking (no trends/actions) | “Out-of-date” risk | Trend review, trigger actions |
| Siloed metrics (not linked to assets/logs) | “Hidden risk” | Centralised dashboard evidence |
| One-off tests/no improvement log | “Compliance fatigue” | Link logs and test cycles |
| Blindspots in coverage (partners/SaaS) | “Opaque risk” | Asset discovery, supplier review |
Show me the log. That’s what every credible board member or regulator will request. The real work is anticipating this demand and building systems where surfacing a record is just a search, not a scramble.
Leadership teams want trend views, readiness heatmaps, and counts of improved issues-not just pass/fail. Audit-complacency, where the numbers are static or surface-level, is a red flag that can trigger supervisory action or market penalties.
All your NIS 2, all in one place
From Articles 20–23 to audit plans – run and prove compliance, end-to-end.
Why Are Static, “One and Done” Metrics Now a Strategic Risk-And How Do You Keep KPIs Alive?
The illusion of safety is the most dangerous compliance error. Static-or “one-and-done”-metrics are no longer accepted as reasonable proof by NIS 2, ENISA, ISO 27001 or sophisticated customers. Repeat findings in audits, stale coverage registers, or improvement logs that don’t trace to tests all signal a compliance monoculture focused on appearances, not adaptation.
Blindspots multiply in silence-metrics that don’t trigger action get weaponized by threats and competitors alike.
Organisations that fail to connect every KPI to a trendline and improvement action not only risk audit failure, but also unmonitored threat growth. The answer: automate detection, coverage, and evidence-handling; demand live improvement logs for every incident or finding; measure the speed and completeness of follow-up, not just the number of items closed.
A continuous improvement–enabled ISMS turns every lesson into new policies, technical measures, and documented evidence-visible to the board, regulators, and even customers.
How Can ISMS.online Turn Compliance KPIs into a Competitive Advantage?
ISMS.online is engineered for this era of evidence-driven, audit-integrated compliance. Its automation, pre-mapped role assignments, and dashboard feeds are built so CISOs, DPOs, IT practitioners, and compliance leaders can move seamlessly from audit review to operational action. It links every KPI-MTTR, coverage, improvement log, policy review-to evidence, roles, and board approval.
Organisations with live, audit-ready, and evolving compliance win more trust-and more deals.
When the next ISO or NIS 2 audit, board review, or supplier ask arrives, evidence is surfaced with a search, not a scramble. Automated dashboards visualise how incidents, gaps, and improvements trend-and auto-record the path from detection to remediation and back. Every stakeholder, from board to IT lead, sees not only numbers but trends, evidence, and who’s responsible for actions.
You don’t simply satisfy regulators-you create an environment where trust, speed, and resilience become your competitive edge.
If your board is ready to move from pass/fail paperwork to “living compliance,” the right time to shift was yesterday-the next best is today.
Let’s make your compliance the engine of your market advantage.
Frequently Asked Questions
What KPIs prove real NIS 2 resilience rather than just compliance?
KPIs like Mean Time to Respond/Recover (MTTR), asset and supplier coverage, and the rate of closed improvement actions offer regulators and boards tangible evidence your organisation can withstand and adapt to cyber threats-not just recite policies. These numbers capture how quickly your team detects and contains incidents, how comprehensively your assets (and third parties) are monitored, and whether every test, simulation, or security event results in a validated change tracked through to closure. While compliance frameworks focus on documented intent, boards now want “living” metrics that reflect ongoing capability and readiness (ENISA, 2023). Audit checklists only prove what should happen, not what did; measurable KPIs demonstrate how your security processes stand up against real-world disruptions and expose improvement over time-bridging regulatory demand and operational trust.
Why do KPIs matter more to boards and regulators than policies alone?
Quantitative KPIs-like coverage percentages or MTTR-are independently verifiable, actionable, and comparable over time or across sectors. Boards use these to benchmark progress, spot gaps, and set strategy; regulators use them to judge whether your compliance outcomes are “paper” or practised. Recognising what’s measured (and how fast you close the gap on exposures) is fast becoming the new standard for proving resilience.
How should MTTR, coverage, and improvement effectiveness be measured and validated for NIS 2 and ENISA?
The most credible approach is automated tracking within your ISMS and supporting tools. MTTR should be time-stamped from first detection through containment and recovery (ideally using SIEM, SOAR, or ticketing platforms integrated with your ISMS), with outliers and trends surfaced in live dashboards. Asset and supplier coverage must link directly to a regularly updated inventory: every device, app, or partner monitored and exceptions both highlighted and resolved (ONETRUST, 2024). Improvement effectiveness is validated only when every event-be it a real incident or a tabletop test-automatically generates a tracked action, mapped to a control, owner, deadline, and supporting evidence. The loop closes with retesting, changes to relevant policies or playbooks, and an audit trail showing status from open to closed.
What does audit-proof documentation look like in practise?
- Dashboards that show fastest, slowest, and average response and recovery times-and highlight overdue incidents.
- Asset heatmaps exposing coverage gaps, overdue reviews, or supply chain weaknesses.
- A clear record where every improvement action links evidence (ticket updates, policy changes, retest outcomes) to a named control or SoA clause.
- Each metric on a dashboard offers direct click-through to logs, changes, and supporting proof-no “data hunt” before an audit.
Why is automation critical for NIS 2 KPI evidence-and what goes wrong with manual processes?
Automation ensures every incident, control review, and improvement action is logged, timestamped, linked, and retrievable-eliminating the gap between discovery and reporting. Platforms like ISMS.online create a continuous chain: as soon as a risk or incident is flagged, related actions are assigned, tracked, and mapped to compliance controls without manual intervention. If you rely on spreadsheets or ad hoc reporting, records age, gaps appear, and attribution blurs-inviting audit findings, loss of trust, or even regulatory penalties when evidence fails a reproducibility test (ISMSONLINE, 2025). Every update should be a living data point, not a static file.
Where do manual KPI processes typically fail?
Manual tracking invites outdated records, missed exceptions, and human error. Ownership of remediation actions can become unclear, and incidents sometimes trigger no follow-up or learning at all. For auditors, any metric that cannot be independently and instantly traced from event through action to outcome risks non-conformity-or worse, missed vulnerabilities that are only discovered after a breach.
What does ENISA demand by “effectiveness”-and how do you build a closed learning loop?
ENISA’s standard for “effectiveness” is a demonstrable, closed-loop cycle: every test, simulation, or real incident triggers a review, assignment, and timestamped improvement. The updated control or policy is then linked to the original event, retested, and only closed once successful (ENISA, 2025). This cycle-review, improve, verify-moves beyond periodic box-ticking, evidencing a proactive, continuous improvement strategy.
No improvement is complete without a retest and a record of who did it, when, and what changed. This alignment of evidence with action is what boards and regulators trust most.
ENISA-aligned improvement cycle, step by step:
- Real or simulated cyber event logged in the ISMS, triggering structured review.
- Action assigned to a specific owner, deadline and relevant control.
- Update logged-policy, playbook, or technical measure-and related evidence attached.
- Improvement closed only after retesting, with every step audit-trailed and board-visible.
How can you provide full traceability from every KPI to audit, board, and regulatory evidence?
Traceability requires connecting incident triggers, risk register updates, controls (particularly SoA links), and logged proof-showing not just what happened but how you responded and learned. To operationalise this, each KPI feeds into a traceable narrative:
| Trigger | Risk Update | Control / SoA Ref | Evidence Logged |
|---|---|---|---|
| Ransomware alert | Root cause review | A.5.27, A.8.15 | Incident report, policy update |
| Service downtime | SLA/risk escalation | A.5.26, A.8.22 | Audit log, board meeting notes |
| Missed backup | Inventory fix | A.5.9, A.8.1 | Backup logs, action review note |
| Test failure | Policy/procedure update | A.5.29, 9.3 | Playbook revision, retest log |
Live links between dashboard metrics and evidential artefacts enable decision makers to interrogate not just outcomes but the process and validity behind each KPI. For boards, this transforms metrics from abstractions to actionable facts; for regulators, it means end-to-end auditability.
How do NIS 2 KPIs, benchmarks, and trends now drive funding, board strategy, and trust?
KPIs now directly influence how boards prioritise investments, allocate resources, and build relationships with partners, buyers, or regulators. ENISA’s NIS360 (“resilience in numbers”) allows for real-world benchmarking of MTTR, asset coverage, and improvement rates-making visible whether your organisation is a sector leader or laggard (Accenture, 2023). Boards use these benchmarks to focus effort, justify funding, and defend strategy; buyers and investors scan for signals of transparency and ongoing improvement. If your improvement closure rates trend up and MTTR trends down, market confidence follows. By contrast, lagging KPIs raise red flags long before an audit report arrives.
| Board Question | KPI Metric | Impact |
|---|---|---|
| Are we above sector average? | MTTR, coverage, improvement % | Board confidence, new investment |
| Where are our biggest risks? | Heatmaps, trending outliers | Focused mitigation, fewer breaches |
| Are our fixes closing? | % improvement actions closed | Strong audits, buyer trust |
Boards and buyers trust visible progress-those who can answer what’s changed and how’s it proven? control the conversation and defend their reputation.
How does ISMS.online enable effective NIS 2 KPI evidence, automation, and continual improvement?
ISMS.online consolidates all your compliance data, automating the translation of incidents, improvements, and coverage checks into time-stamped, control-mapped KPIs with live dashboards. Every key metric can be tied directly to a clause, linked to supporting evidence, and accessed instantly for audits or board reviews. Improvement cycles are tracked from assignment to closure, with full traceability and audit readiness embedded. This not only reduces hidden costs and preparation time for team members-it also lets you engage the board and regulators with ongoing proof of operational maturity and resilience, not just point-in-time compliance.
The new baseline for cyber resilience is simple: transparent evidence, automated assurance, and real improvement. With the right foundations, you move beyond passing audits-you demonstrate continuous progress, win trust, and lead your sector as change accelerates.


